Using Plotly in R for Panel Data Visualization
Holaaa, readers!
Right now, I want to share about how to using plotly in R for Panel Data Visualization. Stay tune :)
Before we talk about how to using plotly in R, I’ll tell you about Panel Data.
What is Panel Data?
Data panel is data that is formed from two data structures, time series and cross section.
Time series is is a group of obsevation on a single entity over time. For example : Number of Rainfall each day in Indonesia for 10 years.
Cross section is a group of observations of multiple entities at a single time. For example : Number of Population for each Indonesian provinces in 2018.
We can call our data as Panel Data if the data organized in both dimentions. For example : Number of Population for each provinces in from 2010–2018.
The data that I used is dataset Gapminder. Just click the link below to get the data!
First of all, input the data from sheet 1, sheet2, sheet 3, and sheet 4. The data format is .xlsx, so we must install package “openxlsx” before we use the appropriate script to input XLSX data into R.
#for sheet 1
gapminder <- read.xlsx("E:\\file kuliah\\smt 6\\Data Visualization\\uk2\\gapminder.xlsx", sheet = 1, startRow = 1, colNames = TRUE)
View(gapmider)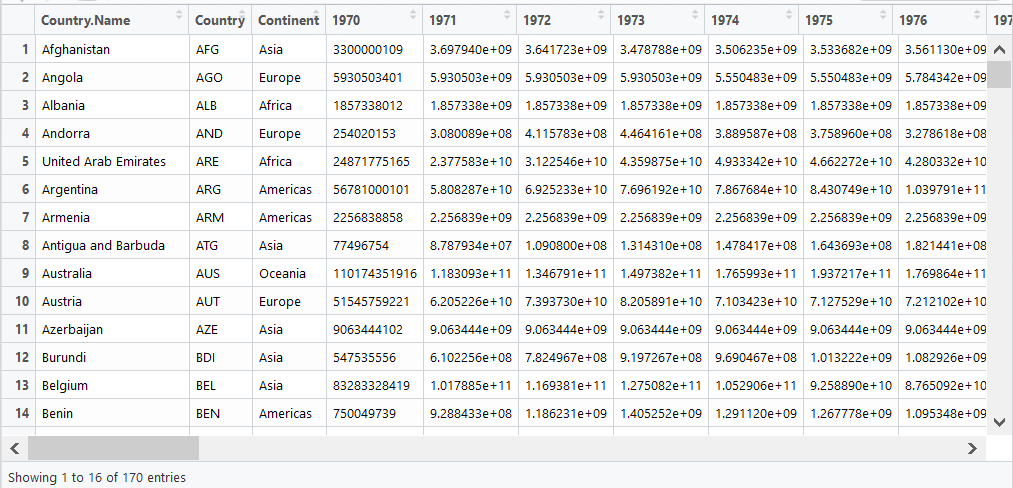
#for sheet 2
gapminder1 <- read.xlsx("E:\\file kuliah\\smt 6\\Data Visualization\\uk2\\gapminder.xlsx", sheet = 2, startRow = 1, colNames = TRUE)
View(gapminder1)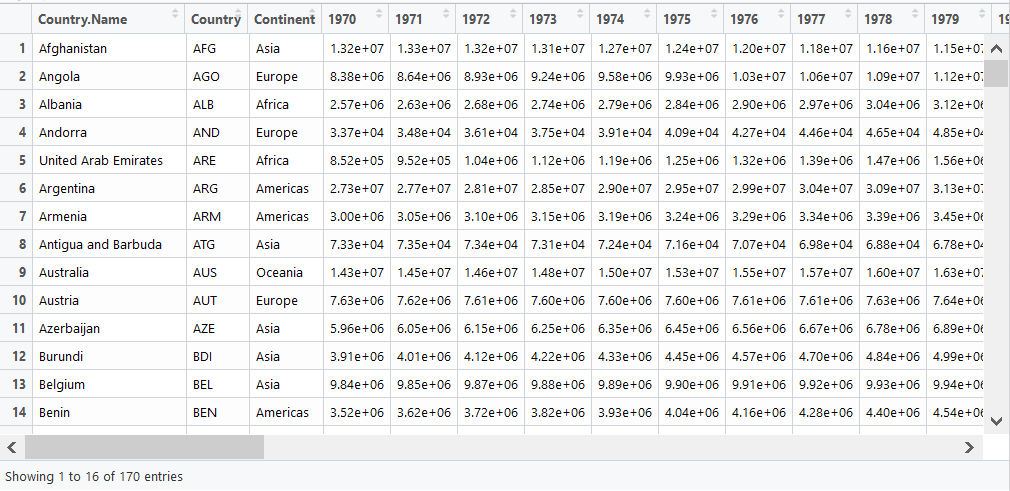
#for sheet 3
gapminder2 <- read.xlsx("E:\\file kuliah\\smt 6\\Data Visualization\\uk2\\gapminder.xlsx", sheet = 3, startRow = 1, colNames = TRUE)
View(gapminder2)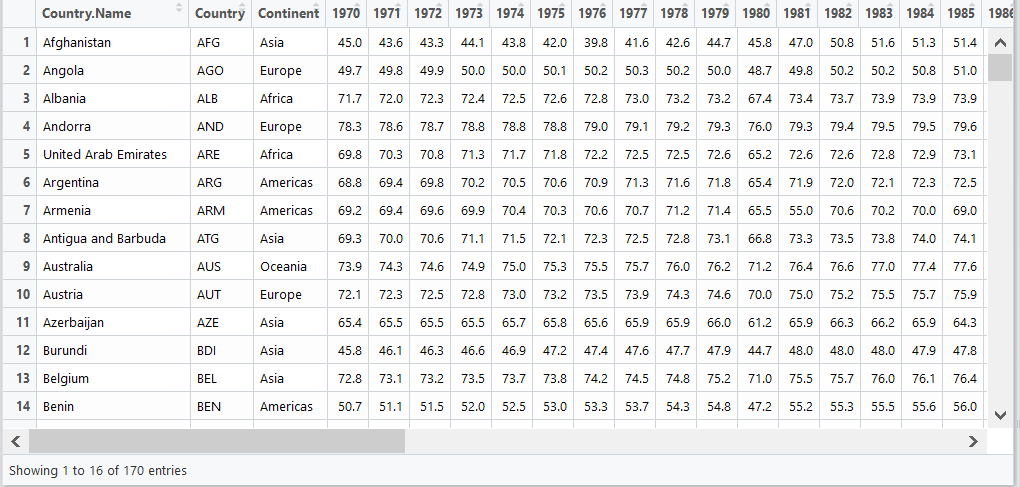
#for sheet 4
gapminder3 <- read.xlsx("E:\\file kuliah\\smt 6\\Data Visualization\\uk2\\gapminder.xlsx", sheet = 4, startRow = 1, colNames = TRUE)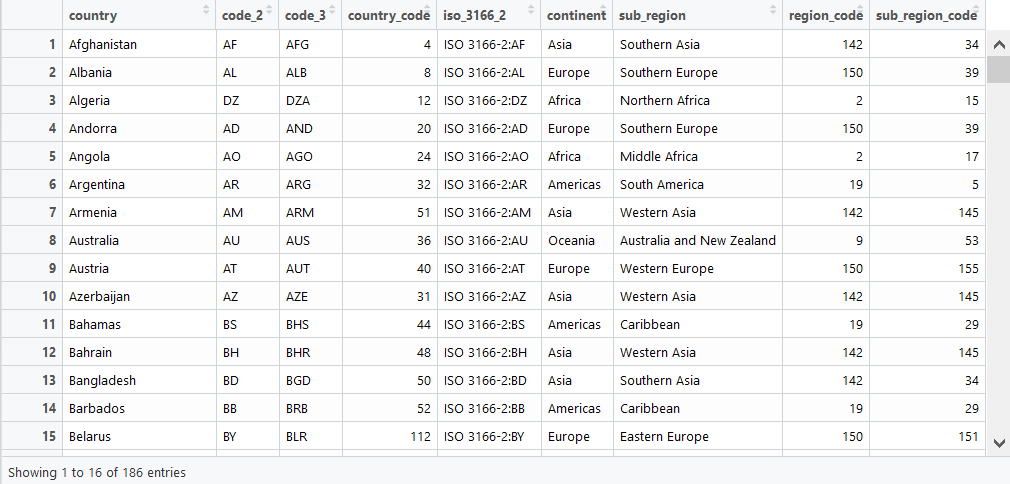
Then create a vector that contains only one column, namely the country. Then repeat as many as 47 times, because of the years from 1970 to 2016. Repeat the years (from 1970 to 2016) as many as 170 times, because there are 170 countries.
#mengambil varibelcountry.vec <- gapminder [,1]
country.vec# membuat pengulangan variabel panel (replikasi)country_panel <- c()
for (i in 1:170)
{
  x = rep(country.vec[i], 47)
  country_panel <- append(country_panel, x)
}
View(country_panel)years_panel <- rep(1970:2016, 170)
years_panelgdp_panel <- c()
for (i in 1:170)
{
 x = gapminder[i,]
 x =  x[-c(1:3)]
 x = t(x)
gdp_panel <- append(gdp_panel, x)
}
gdp_panel
Do the same thing to variable population in sheet 2 and life expectancy in sheet 3.
#mengambil data untuk sheet populasi
pop_panel <- c()
for (i in 1:170)
{
  x = gapminder1[i,]
  x =  x[-c(1:3)]
  x = t(x)
  pop_panel <- append(pop_panel, x)
}
pop_panel#mengambil data life expectation untuk sheet 3
life_panel <- c()
for (i in 1:170) {
  x = gapminder2[i,]
  x =  x[-c(1:3)]
  x = t(x)
  life_panel <- append(life_panel, x)
}
life_panel
The next steps, create a vector that contains only one column (column 6), and namely the region. Then repeat as many as 47 times, because of the years from 1970 to 2016.
region.vec <- gapminder3 [,6]
region.vecregion_panel <- c()
for (i in 1:170) {
  x = rep(region.vec[i], 47)
  region_panel <- append(region_panel, x)
}
region_panel
After getting 6 vectors; namely country_panel, years_panel, gdp_penel, pop_panel, life_panel, and region_panel, combine the vector into a data frame.
gapminder_frame <- data.frame(region_panel,country_panel, years_panel, gdp_panel, pop_panel, life_panel)
View(gapminder_frame)
Below is a snapshot of the original data looks like after loading the dataset into a dataframe.

Next, make a visualization of gapminder_frame ggplot with the name gap1. The x axis is the log of gdp_panel and the y axis is life_panel.
#membuat visual dengan plotlygap1 <- ggplot(gapminder_frame, aes(x = log(gdp_panel), y = life_panel)) + geom_point()
gap1

From the picture above there isn’t any information we can get. So, we need to make a layer based on the years with the name gap2.
gap2 <- ggplot(gapminder_frame, aes(x = log(gdp_panel), y = life_panel)) + geom_point(aes(frame = years_panel))
ggplotly(gap2)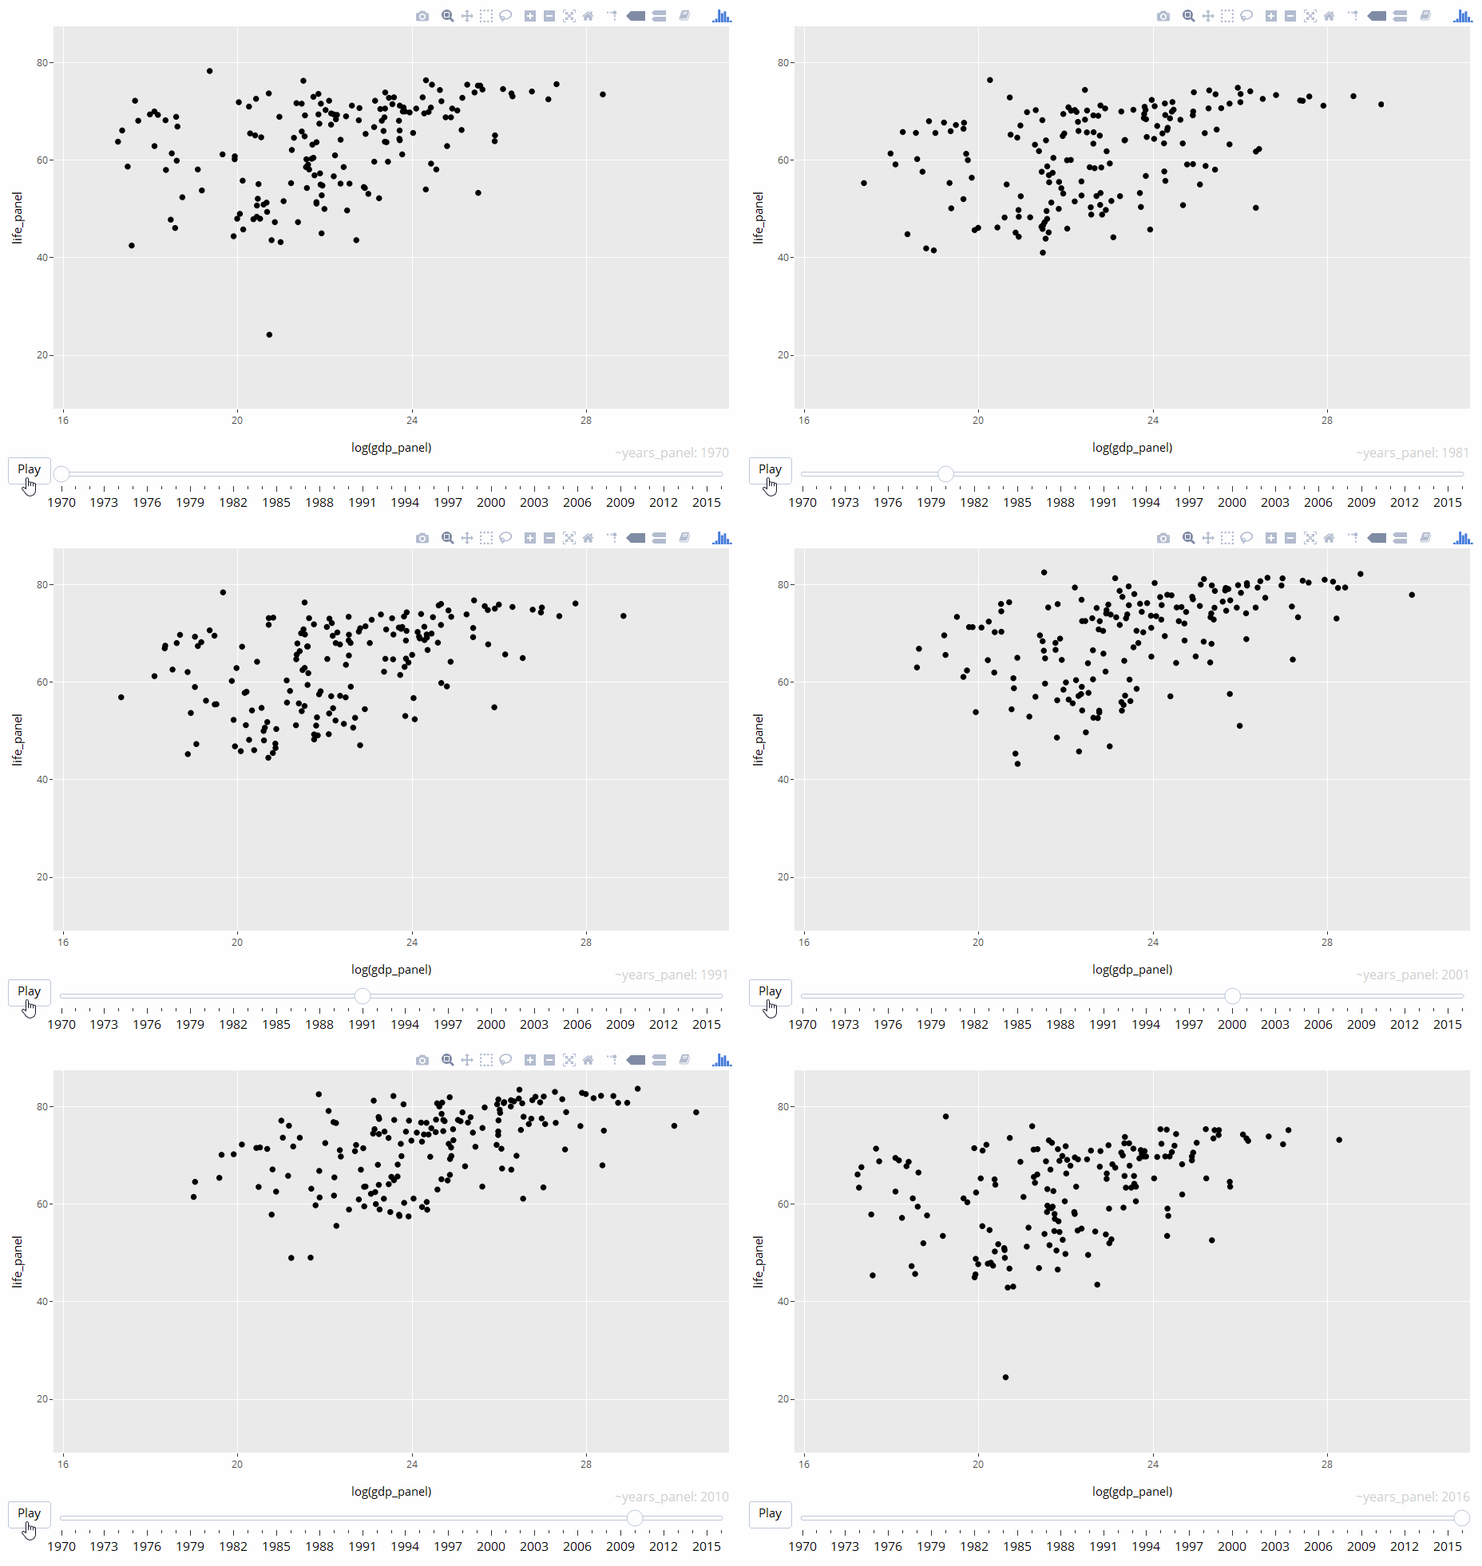
The output above still can’t give the detailed information because all points are black so they cannot be categorized by country. So to distinguish plots by country, we can add the script “color = country_panel” with the name gap3.
gap3 <- ggplot(gapminder_frame, aes(x = log(gdp_panel), y = life_panel, color = country_panel)) + geom_point(aes(frame = years_panel))
ggplotly(gap3)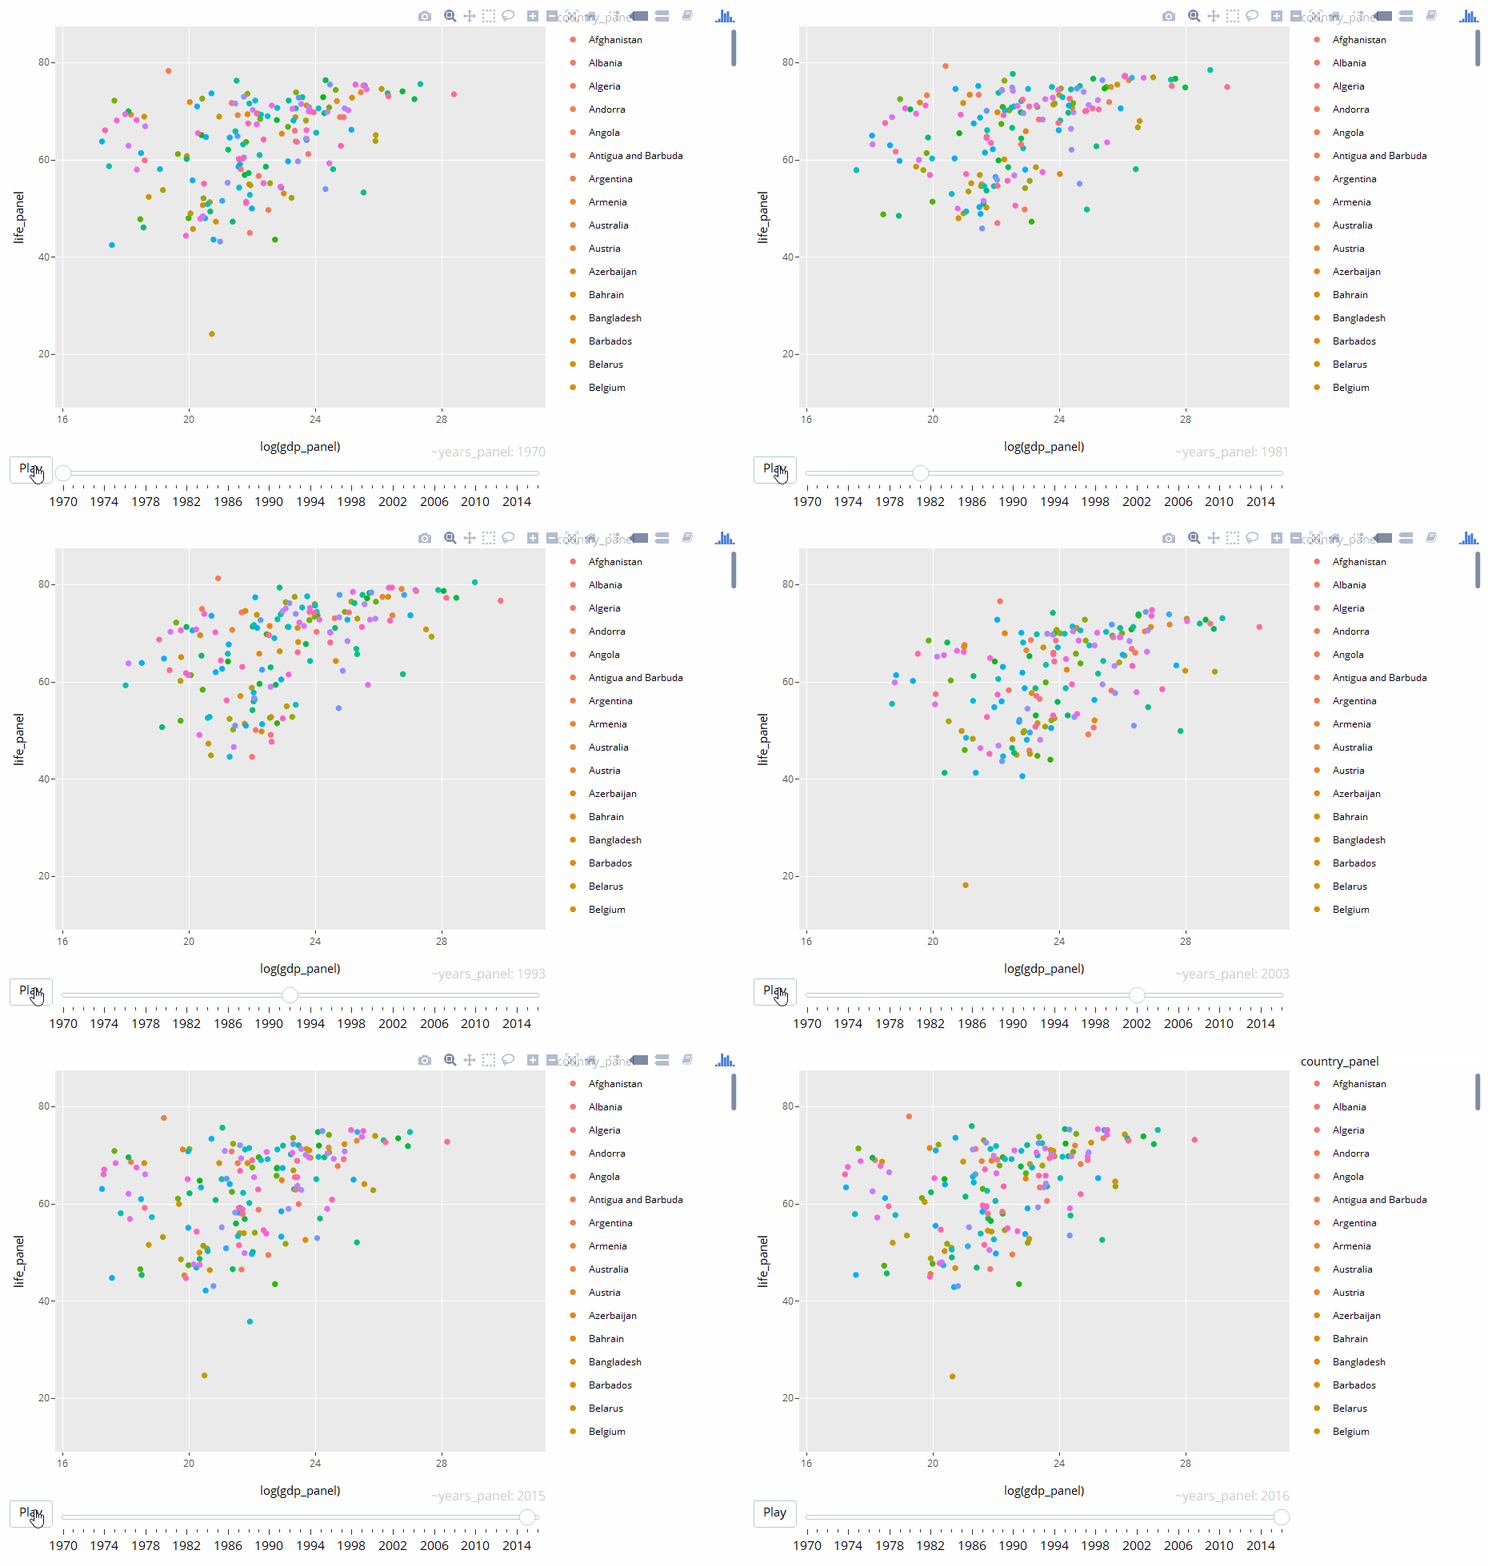
To see the final results, there are several conditions that must be met to get the visualization, namely:
Axis x (x axis) = gdp_panel
Axis y (y axis) = life_panel
Color (color plot) = country_panel
Size (plot size) = pop_panel
Shape (plot form) = region_panel by continent
gap4 <- ggplot(gapminder_frame, aes(x = log(gdp_panel), y = life_panel, color = country_panel)) + geom_point(aes(shape = region_panel,size = pop_panel,frame = years_panel))
ggplotly(gap4)
Yeay! This is how the animation look like. So beautiful, right?
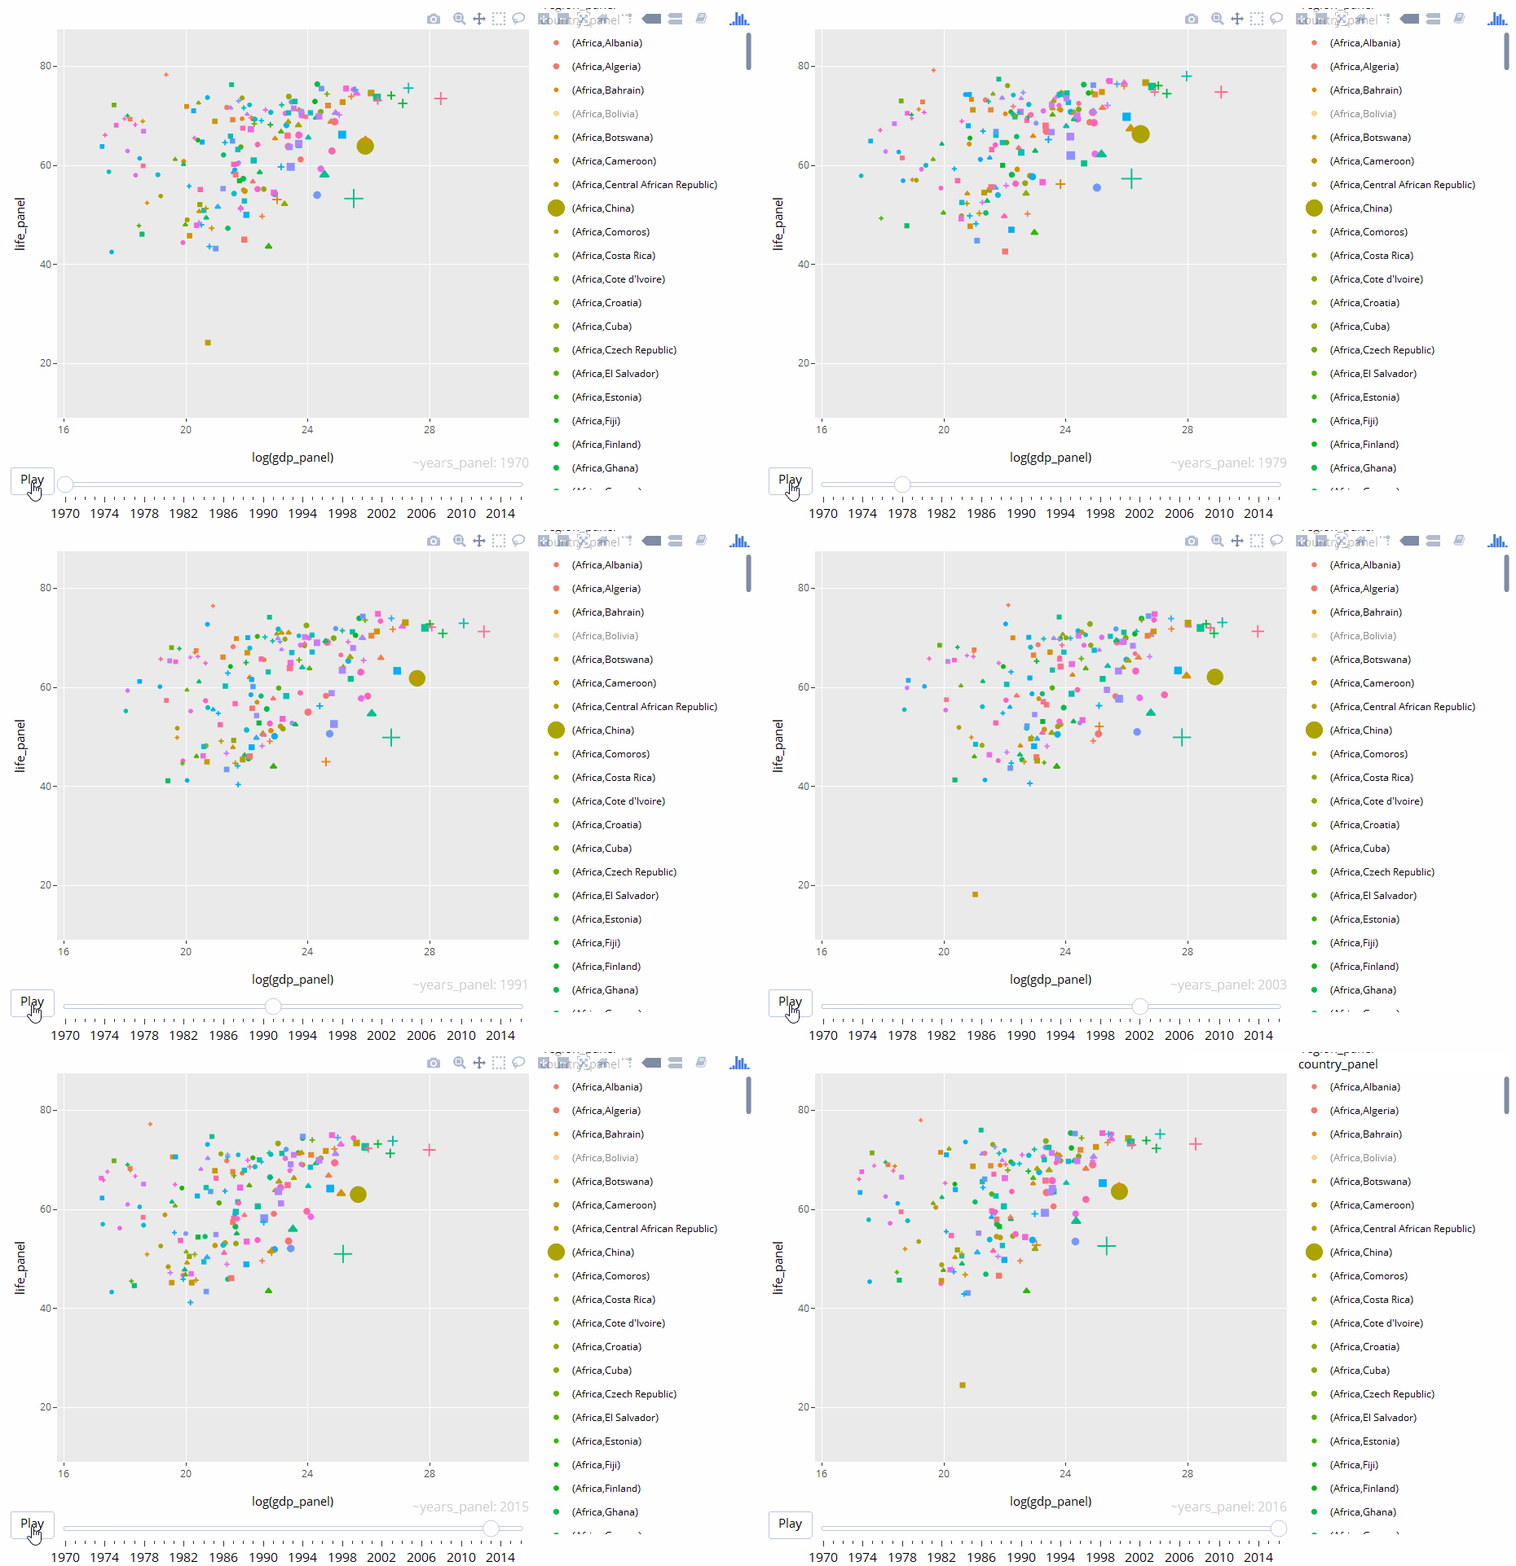
Now you can enjoy your well deserved GIF animation!
See you on another topic!
